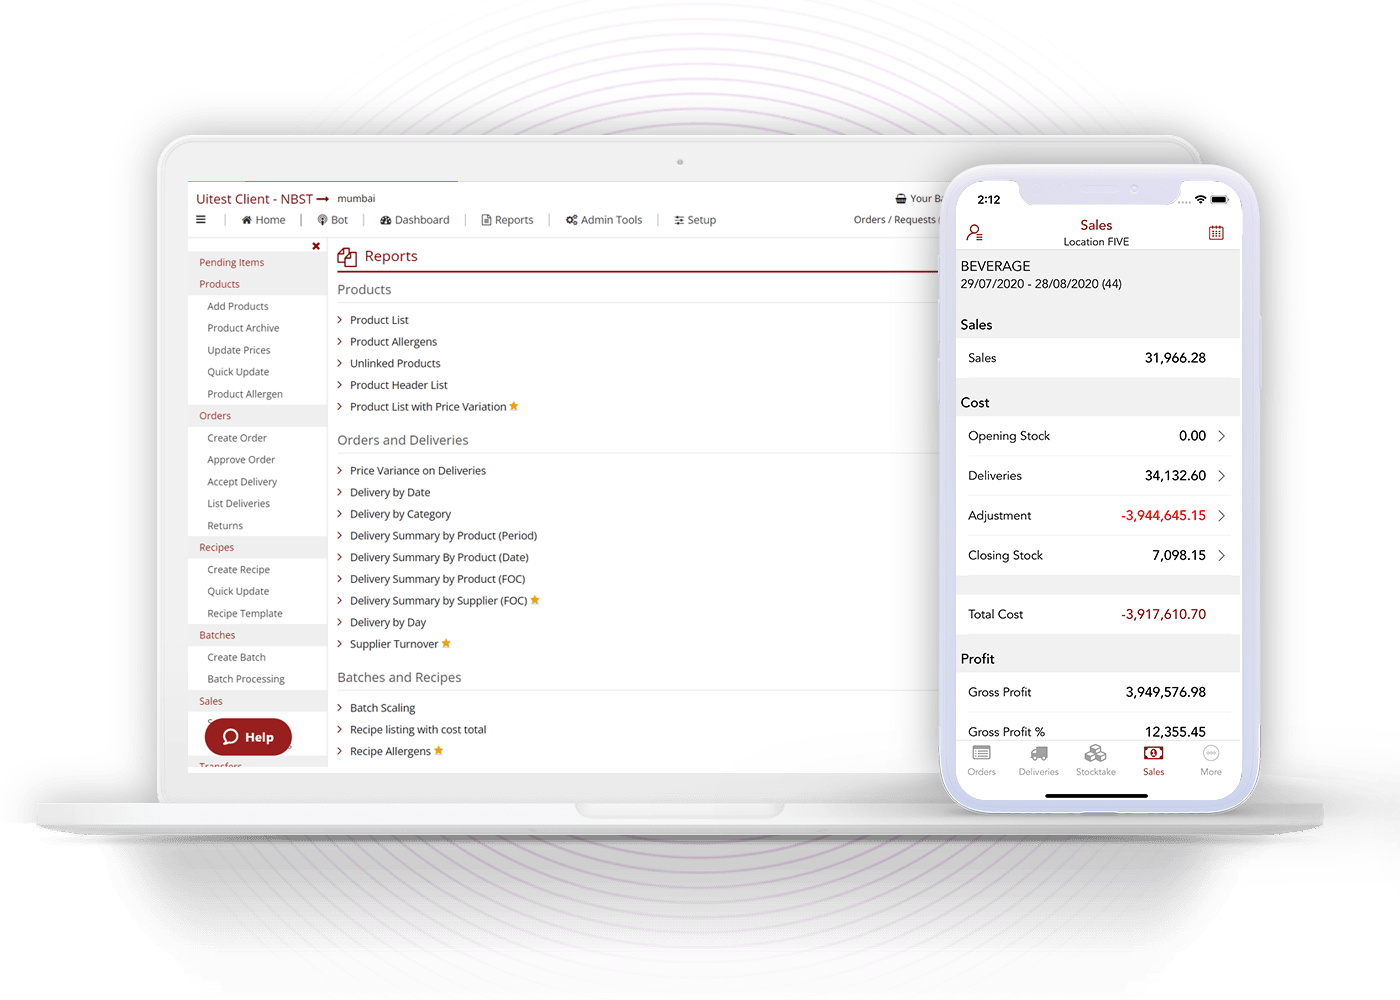
Reporting Analysis makes it easy for salespeople, operations, and service executives to get the most accurate reporting of their teams' time, productivity, and expenses at the touch of a screen. Restaurant analytics software helps you improve quality and control costs by fixing bottlenecks. Get the data analytics for restaurant you need to make smarter decisions, reduce your costs, and keep up with the competition with StockTake Online’s restaurant analytics system.
Get a thorough overview of your business, no matter where you are in the world. StockTake Online provides automated and in-depth reporting capabilities that can help any business owner run their business more effectively and efficiently, even when they are nowhere near the store or the warehouse! Designed specifically to meet the needs of everyone in the hospitality industry, StockTake Online’s analytics software for restaurants makes data analysis simple and accessible so you can see exactly what you need to know at any given time and make changes as needed to improve your business.
The Reports module in our restaurant performance software can easily satisfy clients’ various reporting needs. Our restaurant analytics system enables users to access data about products separately for a more detailed understanding and customisation options that can be applied according to the category, period, etc.
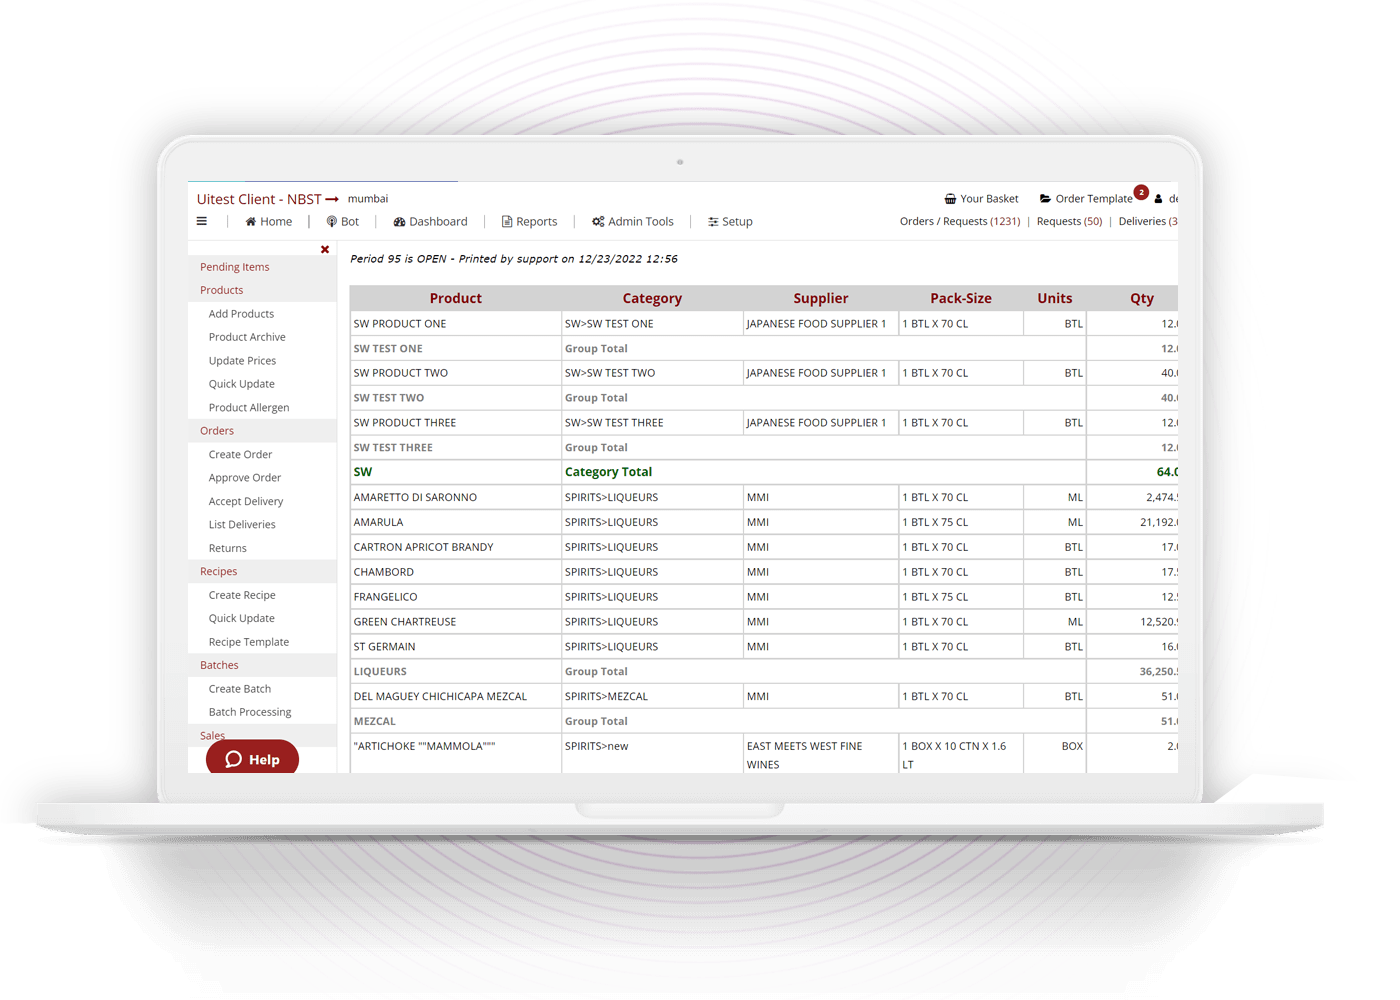
Reports developed under orders and deliveries management are helpful in analysing figures for a specified period with our restaurant performance software. Finance & Audit teams can filter these reports by category, date, product, and supplier to gain insight into the numbers associated with their business during that period using our restaurant analytics tool.
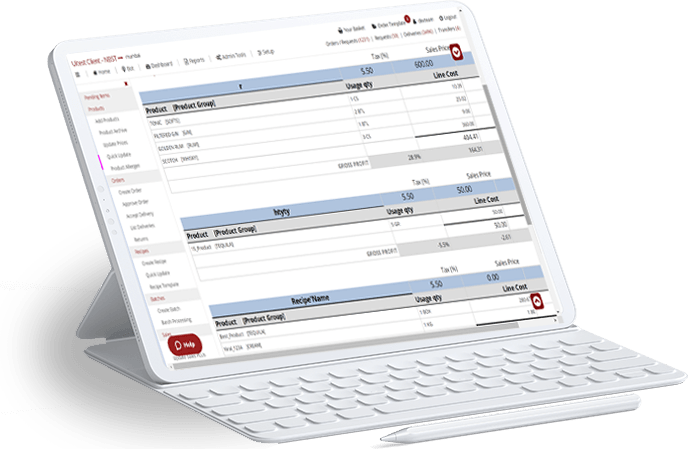
With our restaurant analytics system detailed reports can be obtained for batches and recipes. With batch scaling, we can see which ingredients should be used in what proportion according to the desired output. The scaling feature of our restaurant analytics app provides an opportunity to test different outputs and calculate what ingredients will be used. Recipes without PLU can be found separately.
The summary of all transfers and adjustments done during a specified period, categorized by type or subcategory is available in the transfers and adjustments reporting option of StockTake Online’s data analytics software for restaurant. Food distribution system can be extracted from here for further investigation if necessary, making it the most convenient option which can be accessed directly in our restaurant analytics app.
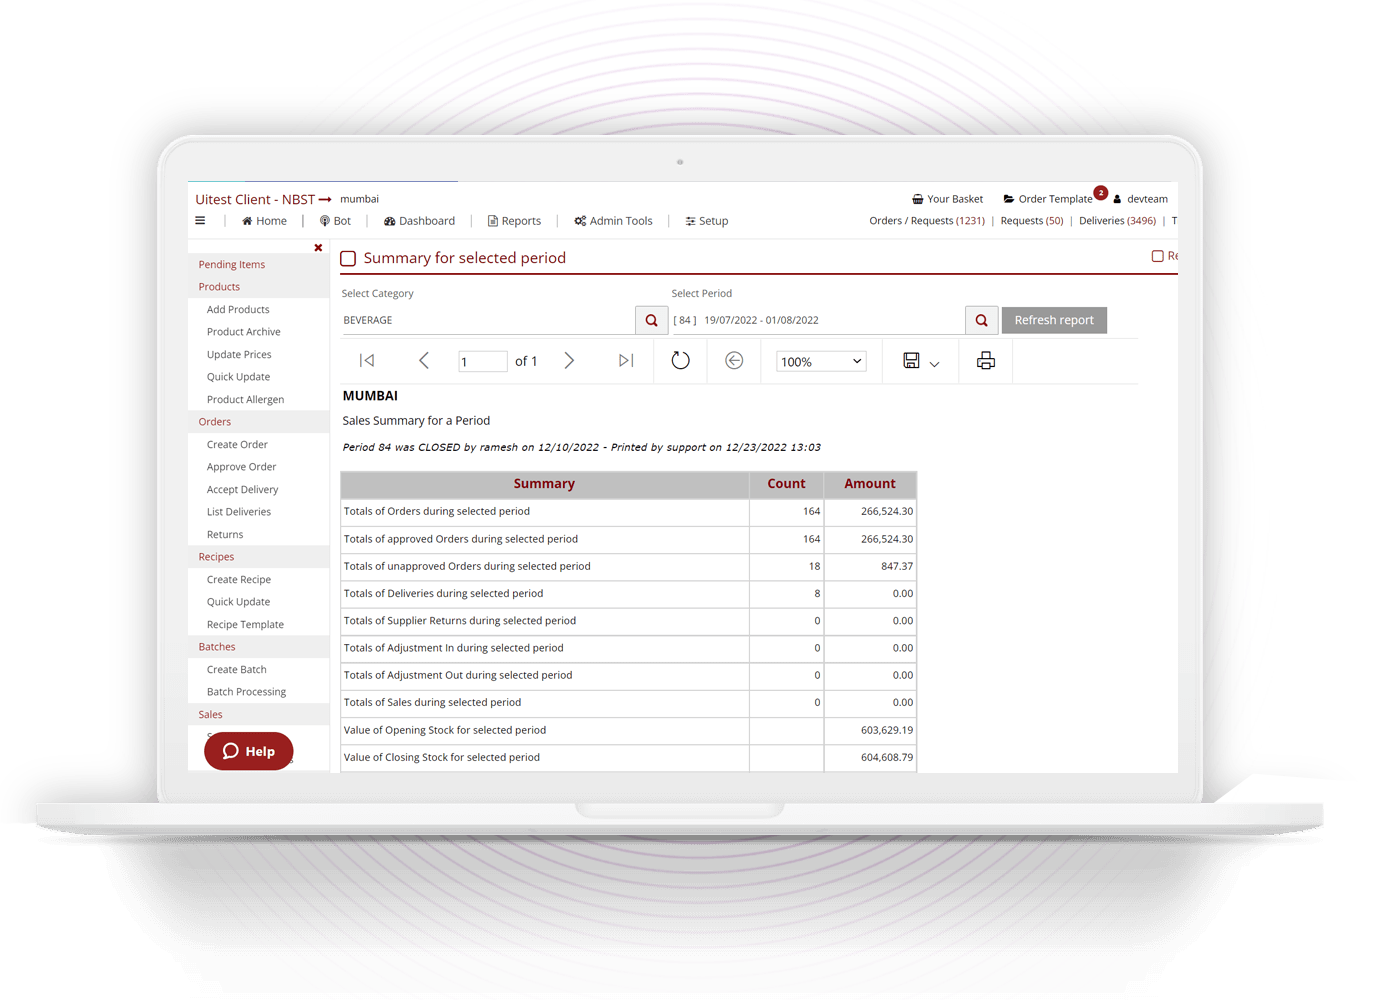
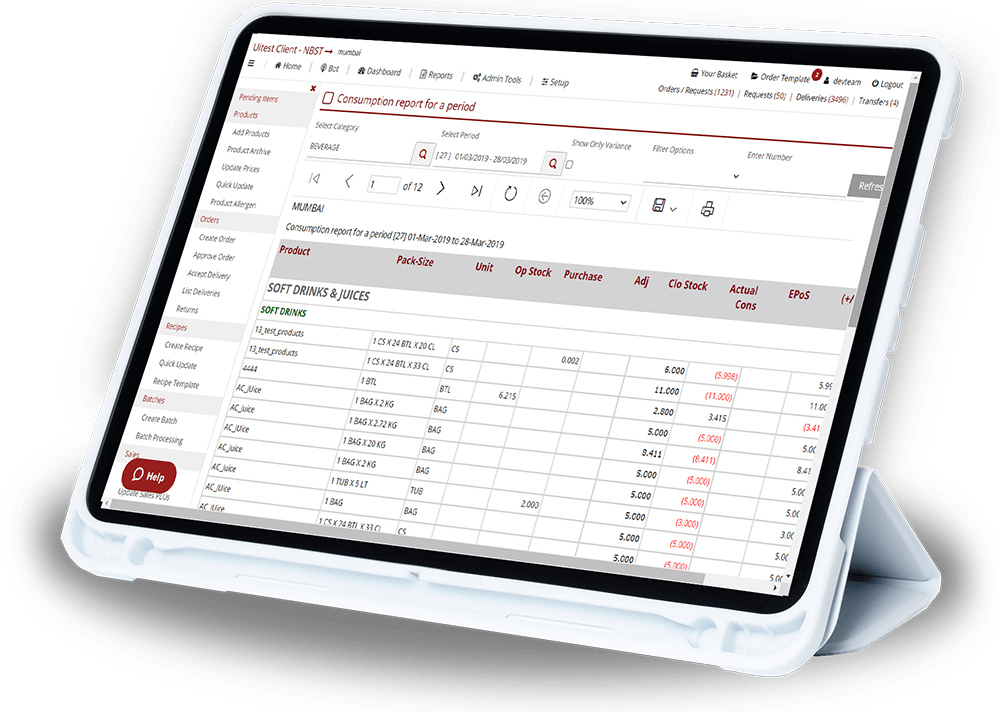
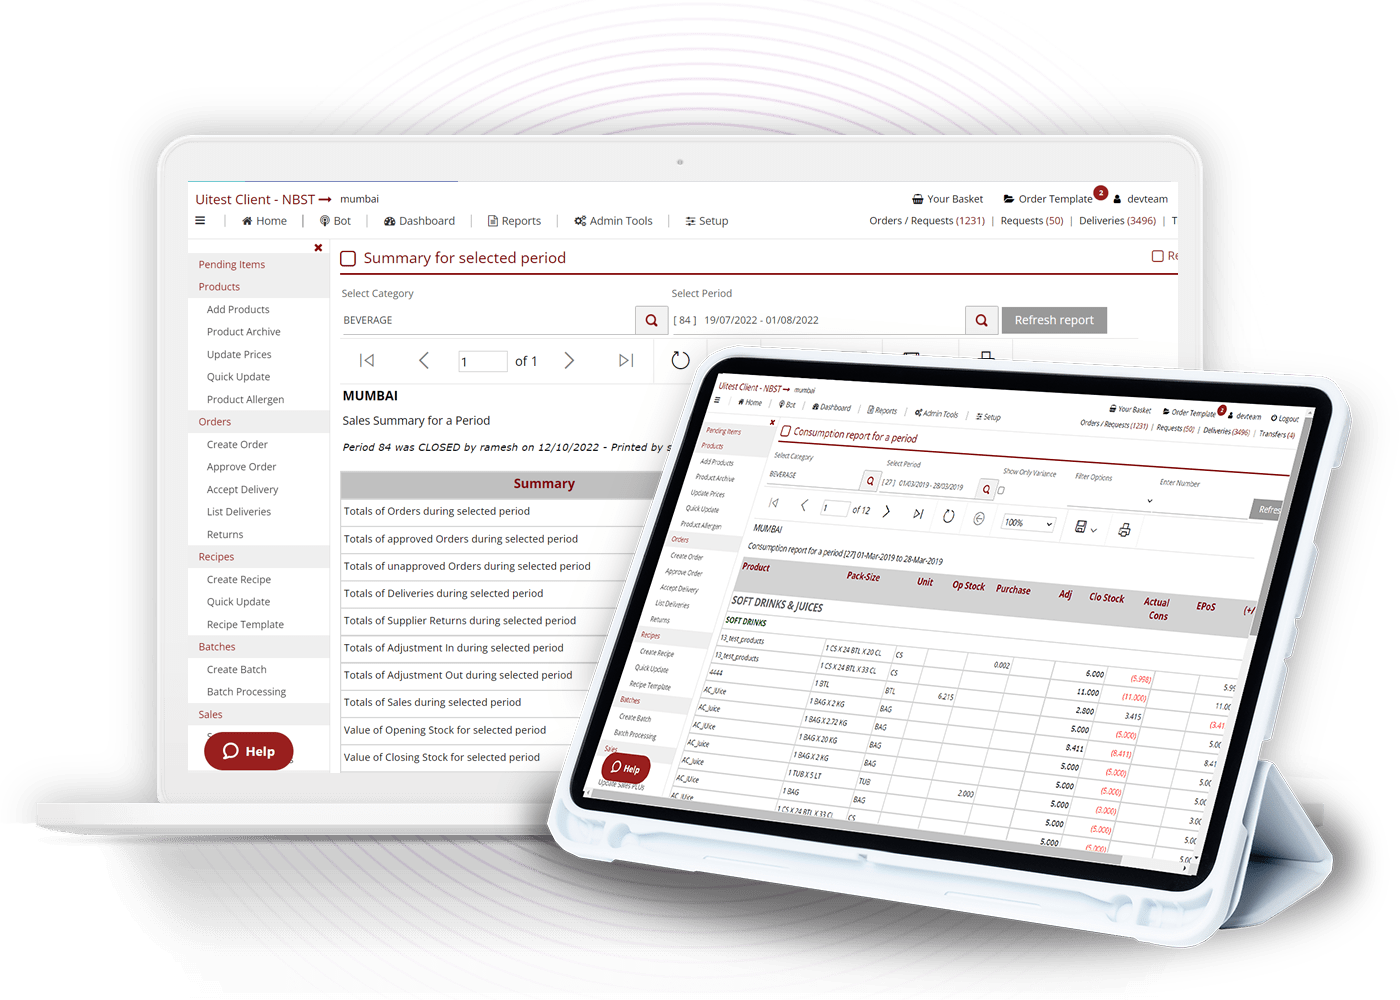
The live consumption report of our restaurant analytics app will show real-time analytics for restaurant on the stock position and give an overview of how much has been consumed. It will facilitate operations and procurement to plan orders more effectively by knowing what products are available in which locations at any given moment.
In Cross Categorisation Sales & Gross Profit report you can view how items are categorised across multiple dimensions to compare their sales figures with those of other categories. This real-time analytics for restaurant give an analysis of where beverage items and food items are used in each location.
With our restaurant analytics software, you also can export this data in various formats including Excel and PDFs, which is convenient when it comes to providing presentations at board meetings or other corporate events.